
This past month at ReadMe has been quite productive! We hosted a 24 hour API radio station, deployed a huge v6 of our API explorer, reimagined our Markdown engine, and released an app on Glitch showcasing how we’re able to demo Developer Metrics.
What better time is there than now to tackle a longstanding project that completely rearchitects how we store, and use, HTTP logs?
70 psi
Historically at ReadMe, our usage of HTTP logs has been extremely lackluster. We either didn’t store valuable information, stored too much unnecessary data that made finding issues difficult, if not impossible, or the logging platform we used made navigating logs a chore.
ReadMe runs on Heroku, so the logs that we have access to via heroku logs --tail are a raw firehose of data from their Logplex router. Have you ever turned a hose on a dog and watched them try, and fail, in spectacular fashion, to gobble up all of the water? That was us trying to make use of this supersonic stream of logs.
ELK
I fell in love with Kibana when I was working at Vimeo on its API. The dashboards we were able to construct allowed us to quickly, and easily, find and discover problems in the platform before they became problems. This is something I’ve been evangelizing since coming to ReadMe.
The problem, however, is that there isn’t a one-click Heroku marketplace solution for extracting logs into an Elasticsearch and Kibana stack, like there is for the other logging platforms. Elastic and Kibana are available there, but only as part of a general purpose cloud storage solution. Maybe we can use that somehow…
Improving our HTTP logs
Before we dig into how we can roll up something to use Elastic and Kibana, we need to first improve our general purpose HTTP logs. Since we’re a Node shop, we are currently using the Morgan package for compiling, with the default dev format, and outputting our logs to stdout.
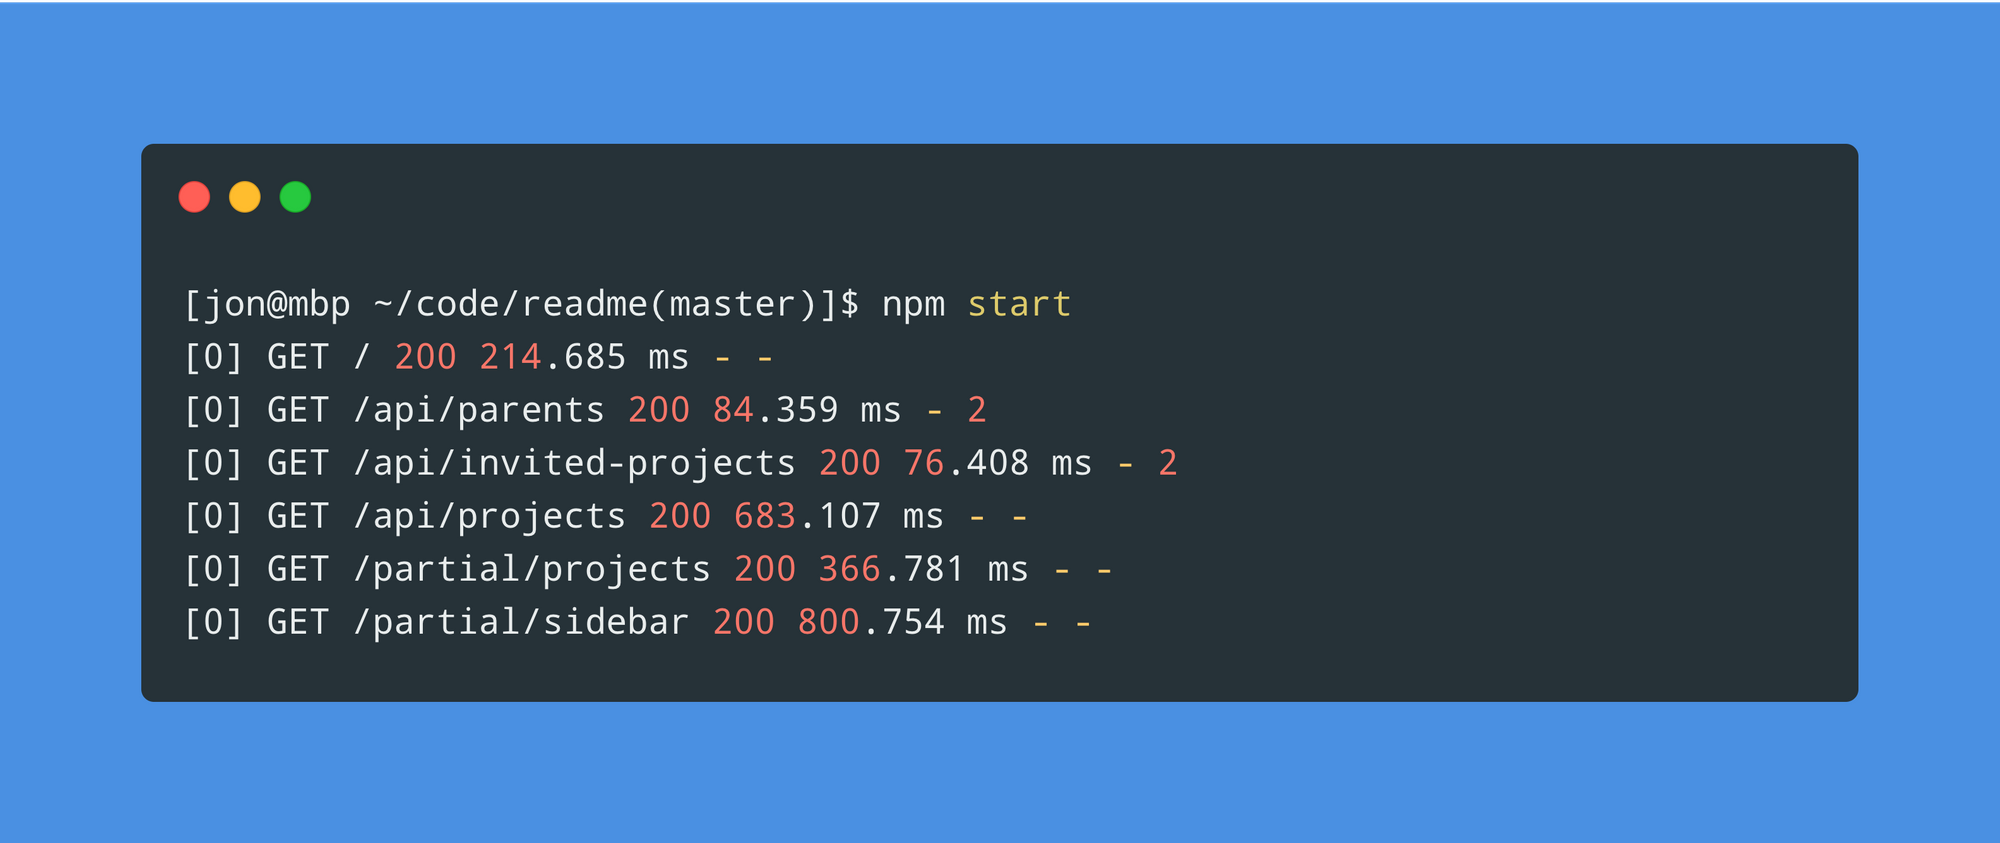
While these logs are great for local development, logging this format in production is less so. There’s no dates, user-identifiable data, or information on the ReadMe project that was used, and we don’t have Heroku’s X-Request-ID header anywhere. We can do better than this, and thankfully Morgan is extensible for us to log whatever we want by constructing some custom middleware and passing it a custom function:
module.exports = inlet => {
return morgan((tokens, req, res) => {
const contentLength = tokens.res(req, res, 'content-length');
const responseTime = tokens['response-time'](req, res);
const referrer = tokens.referrer(req);
const metadata = {
inlet,
isEnterprise: req.project && req.project.isEnterprise(),
project: req.project ? req.project.name : undefined,
'x-request-id': tokens.req(req, res, 'x-request-id'),
};
return [
tokens['remote-addr'](req, res),
'-',
`[${tokens.date(req, res, 'clf')}]`,
`"${tokens.method(req)} ${tokens.url(req)} HTTP/${tokens['http-version'](req)}"`,
tokens.status(req, res),
contentLength !== undefined ? contentLength : '-',
responseTime ? `${responseTime} ms` : '-',
`"${referrer !== undefined ? referrer : '-'}"`,
`"${tokens['user-agent'](req)}"`,
'-',
JSON.stringify(metadata),
].join(' ');
});
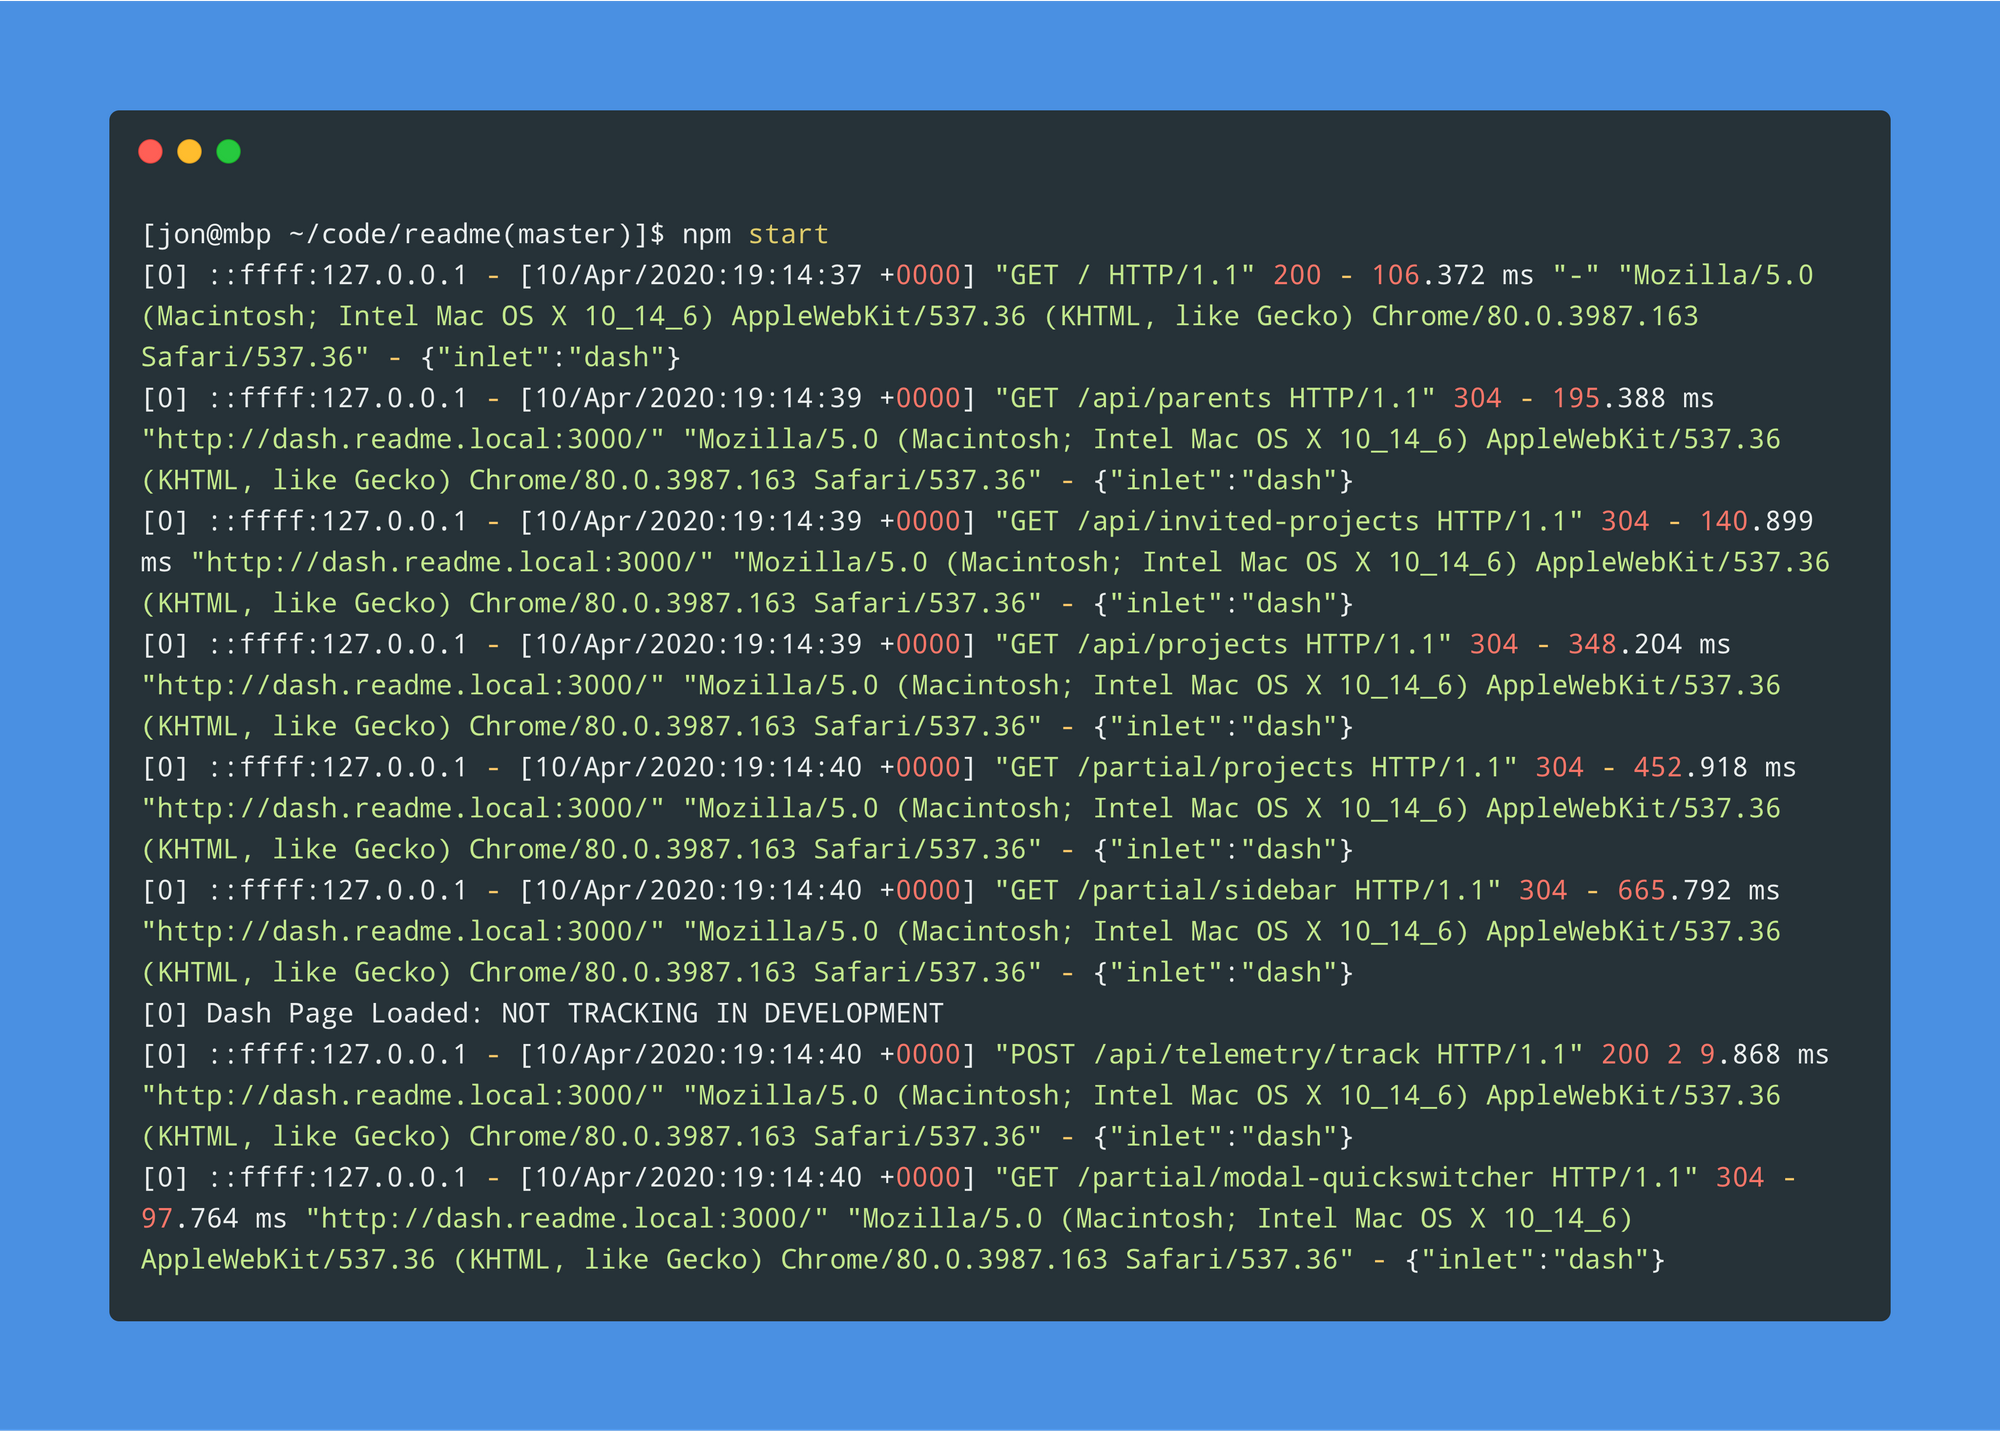
};With a custom logger like this, we’re now able to log a healthy amount of useful information.
But how can we make better use of these logs?
Logstash
Logstash is a server pipeline that can ingest logs from any number of sources, mutate them, and then send them along to another source (like an Elasticsearch cluster). The problem that we’ve got is that, since we’re on Heroku, we’re still bound by its Logplex routing layer. Thankfully, Heroku has a service called Log Drains that allows you to configure a “drain” on your logging firehose. This is our golden ticket.
127.0.0.1 - [11/Apr/2020:00:35:14 +0000] "GET / HTTP/1.1" 200 - 121.675 ms "-" "Mozilla/5.0 (Macintosh; Intel Mac OS X 10_14_6) AppleWebKit/537.36 (KHTML, like Gecko) Chrome/80.0.3987.163 Safari/537.36" - {"inlet":"dash"}With our newly reformatted logs, we now need to figure out how we can ingest them, and only them, into Elasticsearch. This way, we aren’t just replicating the same old firehose in a new datastore. There is a debugging tool, Grok Debugger, that is wonderful at not only teaching you how the Logstash Grok filter plugin works, but assists in constructing a Grok-compatible expression. A similar tool also exists within Kibana, and can be found under “Dev Tools.”
With the Grok Debugger, we’re able to construct the following expression to match our new log format:
%{IP:ip_address} - \[%{DATA:date}\] "%{WORD:method} %{URIPATH:url} HTTP/%{NUMBER:http_version}" %{NUMBER:http_code} %{DATA:content_length} %{DATA:response_time} ms "%{DATA:referrer}" "%{DATA:user_agent}" - %{GREEDYDATA:metadata}Some things to note here: Since we log a - for content_length and response_time if we don’t have it, we need to use Grok’s DATA pattern instead of NUMBER. If we used the latter, the full log wouldn’t get matched because - isn’t a number. We could potentially clean this up by writing a custom pattern, but c'est la vie.
From here, we can finally start to build out our Logtash pipeline:
input {
  tcp {
    port => "1514"
  }
}

filter {
  grok {
    match => {
      "message" => '%{IP:ip_address} - \[%{DATA:date}\] "%{WORD:method} %{URIPATH:url} HTTP/%{NUMBER:http_version}" %{NUMBER:http_code} %{DATA:content_length} %{DATA:response_time} ms "%{DATA:referrer}" "%{DATA:user_agent}" - %{GREEDYDATA:metadata}'
    }
    add_tag => ["readme_web"]
    remove_field => ["date", "host", "port", "message"]
  }

  if "readme_web" in [tags] {
    json {
      source => "metadata"
    }

    mutate {
      convert => {
        "http_code" => "integer"
        "http_version" => "float"
        "isEnterprise" => "boolean"
      }

      remove_field => ["metadata"]
    }

    if [content_length] !~ "-" {
      mutate {
        convert => {
          "content_length" => "integer"
        }
      }
    } else {
      drop {
        remove_field => ["content_length"]
      }
    }

    if [response_time] !~ "-" {
      mutate {
        convert => {
          "response_time" => "float"
        }
      }
    } else {
      drop {
        remove_field => ["response_time"]
      }
    }
  }

  if "_grokparsefailure" in [tags] {
    drop { }
  }
}

output {
  if "readme_web" in [tags] {
    elasticsearch {
      hosts => "yourElasticSearchCluster"
      user => "username"
      password => "password"
      index => "readme"
    }
  }
}
Some things to note with this pipeline:
- We’re junking
datebecause data gets timestamped anyway in Elastic (as@timestamp) and it’s silly to manage two dates. - The Logstash Mutate filter plugin takes our JSON-encoded data in
metadataand explodes it out into individual pieces of data. - We’re re-typecasting
http_code,http_version, andisEnterprisebecause all logs we’re dealing with are strings. - When Grok is unable to match a log, it adds the
_grokparsefailuretag, and since we don’t want junk data in our new logging service, we’re ignoring those. If for some reason you happen to notice that your log totals have dropped, you should debug this tag to see if maybe you’re dumping information, as perhaps your log format changed and your match pattern needs to be updated. - Finally, since we’re shipping logs from Logstash to Elasticsearch, we’re using the Elasticsearch output plugin. Logstash offers a handful of other ways to deliver your logs to other services, but for our purposes we want those crispy Kibana dashboards so we’re using ES.
Docker
With our freshly minted Logstash pipeline config, it’s time to see if it actually works. We can use Docker to take care of that. Elastic offers a premade Logstash image that we can easily pull down and use within a Dockerfile:
FROM docker.elastic.co/logstash/logstash:7.6.2
RUN rm -f /usr/share/logstash/pipeline/default.conf
COPY pipeline/ /usr/share/logstash/pipeline/
COPY config/ /usr/share/logstash/config/

EXPOSE 1514/tcp
Drop a logstash.yml file in a config/ directory with the following:
http.host: "0.0.0.0"Save our new pipeline config to pipeline/default.conf, and run the container:
docker build . -t logstash
docker run -p 1514:1514 -t logstash
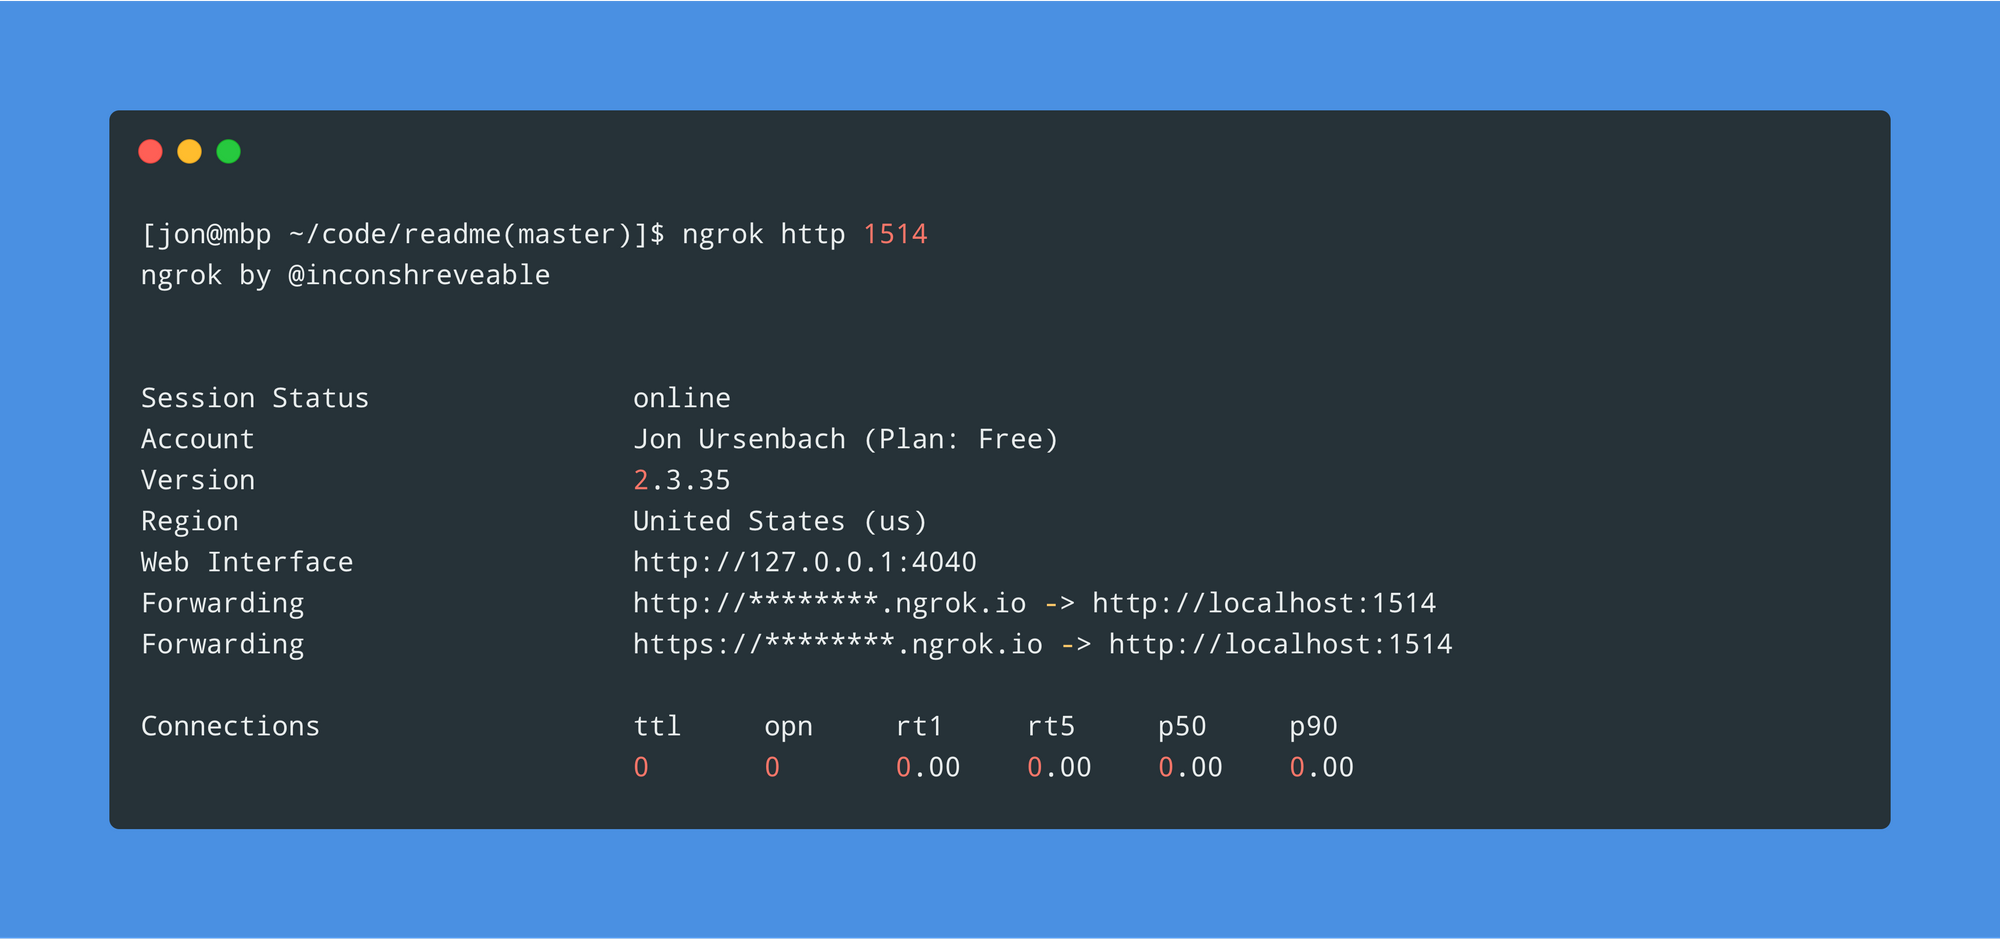
Now since we’d like to debug this before building out some infrastructure in our production environment, let’s go ham and point our production log drain to our local machine with ngrok.
ngrok http 1514
With ngrok running, we can now set up a log drain on our Heroku app.
heroku drains:add http://<<ngrok uuid>>.ngrok.io
You should immediately start to see connections pouring in to your machine in the ngrok console!
If you’re happy with the results, remove the drain:
heroku drains:remove http://<<ngrok uuid>>.ngrok.io
🆘 If you’re seeing “Bad Gateway” errors coming through in ngrok, that means either that your Docker container hasn’t finished booting, or Logstash crashed because of an error in your pipeline config. Check your Docker logs for details on what went wrong.
Deployment
Now that we’ve got a functional Logstash pipeline, and a manageable Docker container, we can deploy this all to production! Spin up a server somewhere, get that HTTP(s) URL, add it as a log drain and sit back and watch all your logs come in.
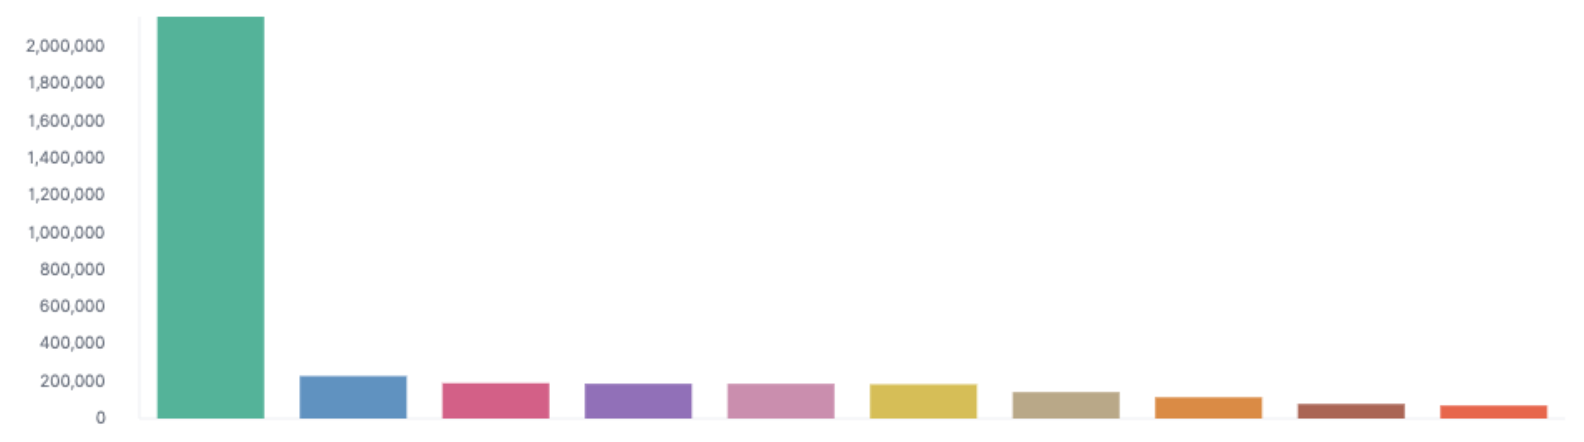
The reception around the office to these changes, after a scant 12 hours, were pretty enlightening. Not only are we going to be able to have better eyes on the health of our services, but after just a day in production we were able to identify a bug in our frontend JS that was causing users to query an API of ours even when the page wasn’t active. This coupled with a user’s session expiring over the weekend, but their browser remaining open, resulted in this hilarious graph that we wouldn’t have been able to easily identify otherwise:
I’ll end this with a note that I am absolutely not an expert in Logstash, the rest of the ELK stack, or Docker, and learned all of this in less than a week so I am sure that there are things that could be improved with our pipeline or setup.
If you’ve got suggestions for improvements or cleanup, please let us know!