When considering what makes a great developer experience, we usually break it down into the three stages of your developer lifecycle:
- Evaluation & onboarding 🤔 Educating users about what’s possible and helping them make their first API call as quickly as possible
- Engagement & support ❤️ Giving users the tools to build efficiently and helping them debug issues when they run into roadblocks
- Retention & growth 📈 Driving adoption of new API features, increasing usage over time, and ensuring a smooth transition for users to new API versions
Supporting this full developer lifecycle — from the first call through long-term integration — is what we aim to do here at ReadMe. Creating a great experience for your API users is no different than for any other product: the exact tactics you use may vary, but at the end of the day, you’re helping people with a problem to solve and a job to do.
What’s possible with your API? How can your developers start building? And what can they do when things go wrong? These are the answers users are looking for in your developer hub, and we’re excited to help you deliver them ✅
Introducing Developer Dashboard
API teams talk about “Time to First Call” as a north-star metric for their developer experience: how quickly they can engage and enable a new developer to make their first API call. There are several things that go into this process (and several potential pitfalls along the way), so we’ve recently shipped improvements across the entire ReadMe experience to make this simpler for new users. Together, these features make up your Developer Dashboard, baked directly into your ReadMe dashboard and hub 🎉
Lowering the on-ramp for new users
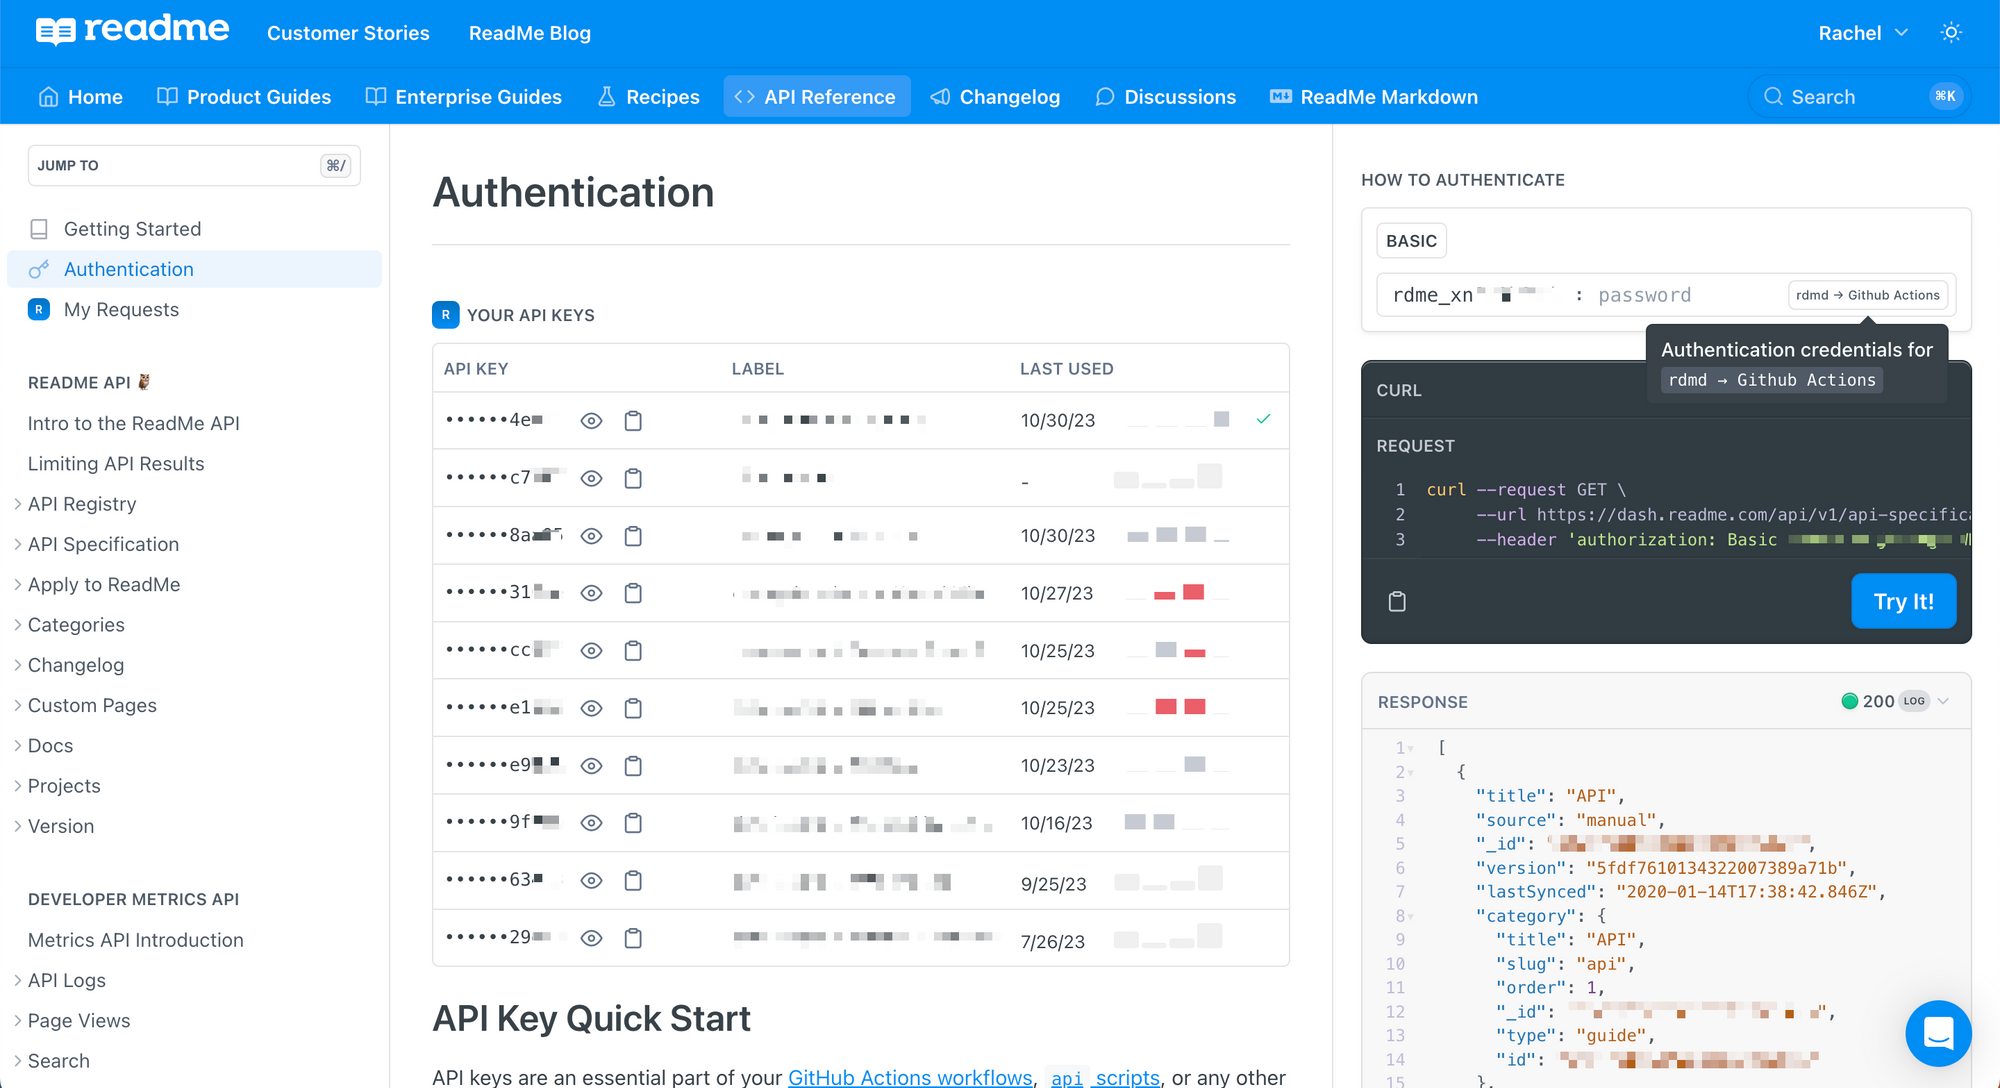
Instead of giving users complicated instructions on how to hunt down their keys, bring the keys into your hub exactly where they’re needed! ReadMe’s Getting Started & Authentication pages give users instant access to their API keys so they can jump in right away. With their API keys front and center, new developers can easily use the Try It playground to send their first authenticated request 🙌
After they’re up and running, their API keys are easily accessible in Try It anytime they’re checking out a new endpoint. Server variables or other custom data can be piped in too, so everything they need is at their fingertips:
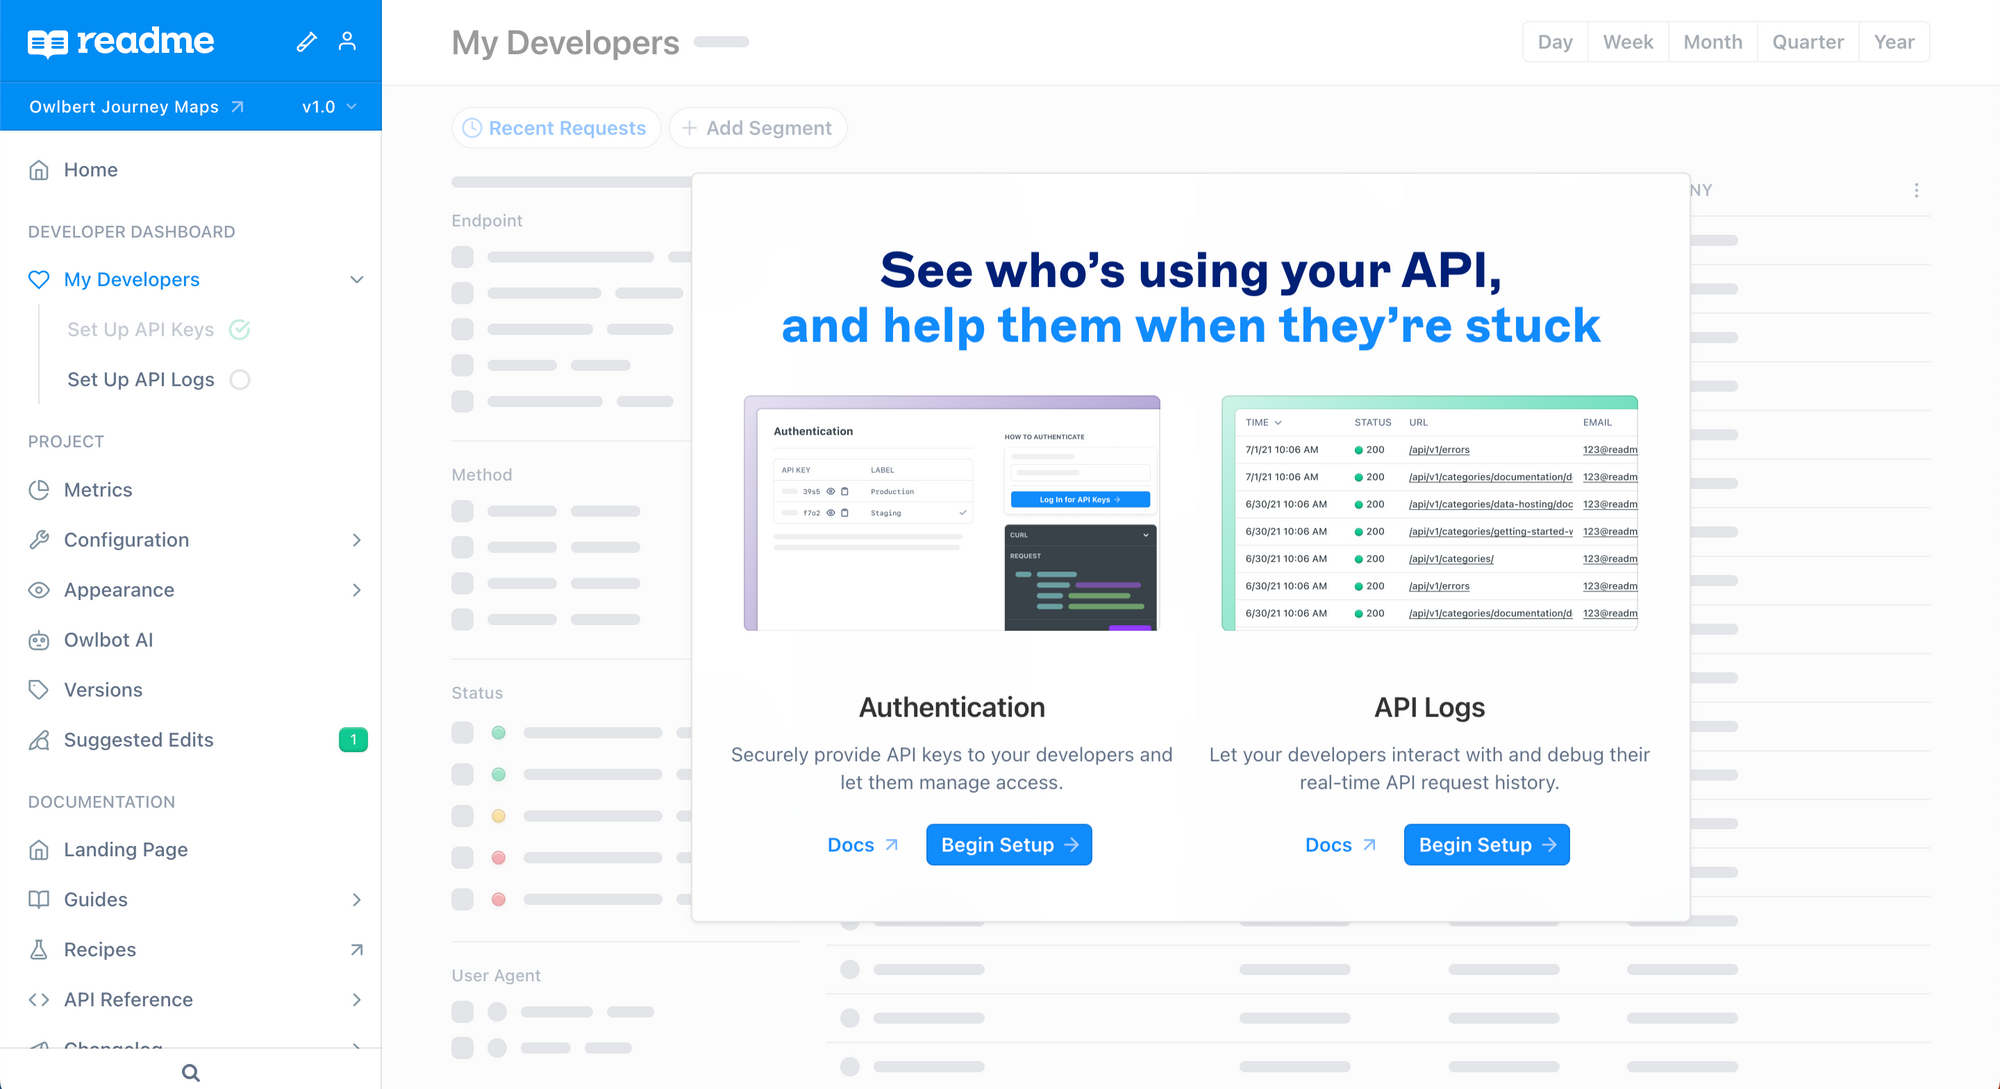
In addition to improving the developer experience in the hub, we’ve also improved the onboarding experience for ReadMe Admins by streamlining the setup process for these features. Now, both the “Set Up API Keys” page and the “Set Up API Logs” page are unified under the My Developers area of your project dashboard, with clearer indications of what’s been configured and what setup steps still need to occur.
Getting on the same page to debug issues
You’ve made it easier for new users to get started — now what? Inevitably, they’ll run into issues (it happens to the best of us!), so making the debugging experience as efficient and painless as possible is the next priority.
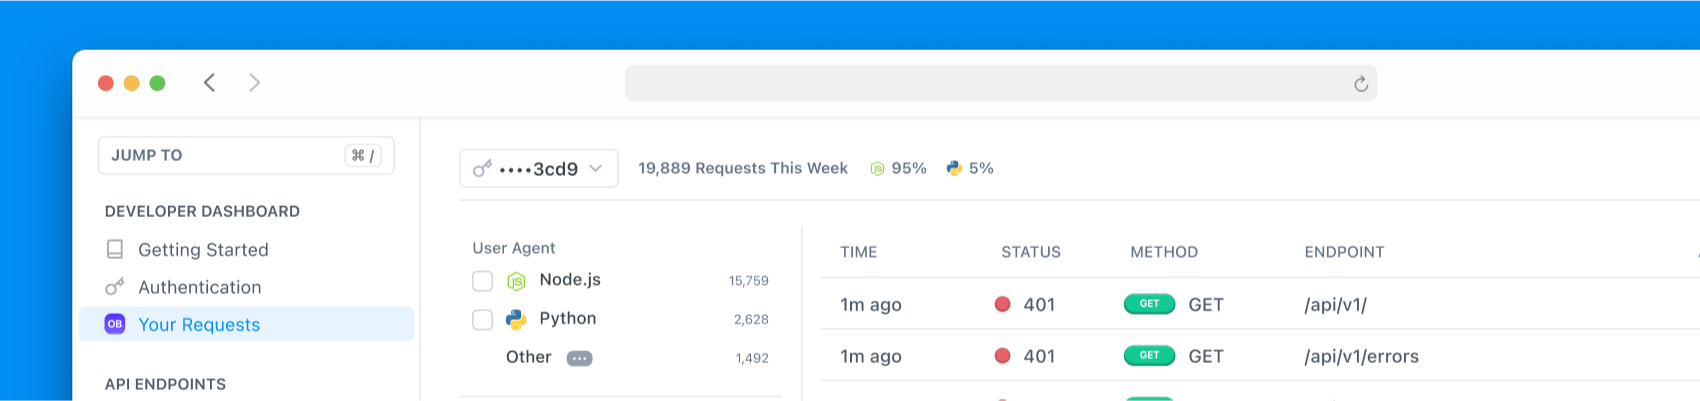
Your first line of support should be to give users the tools to try to debug on their own. If they can figure out what’s going on in a few minutes and avoid waiting for a support ticket to be answered, that’s the dream 🌠 Now, users can see their previous requests for all API keys they have access to on the My Requests page in the API Reference, so they can quickly dig into failing requests and see what’s going on.
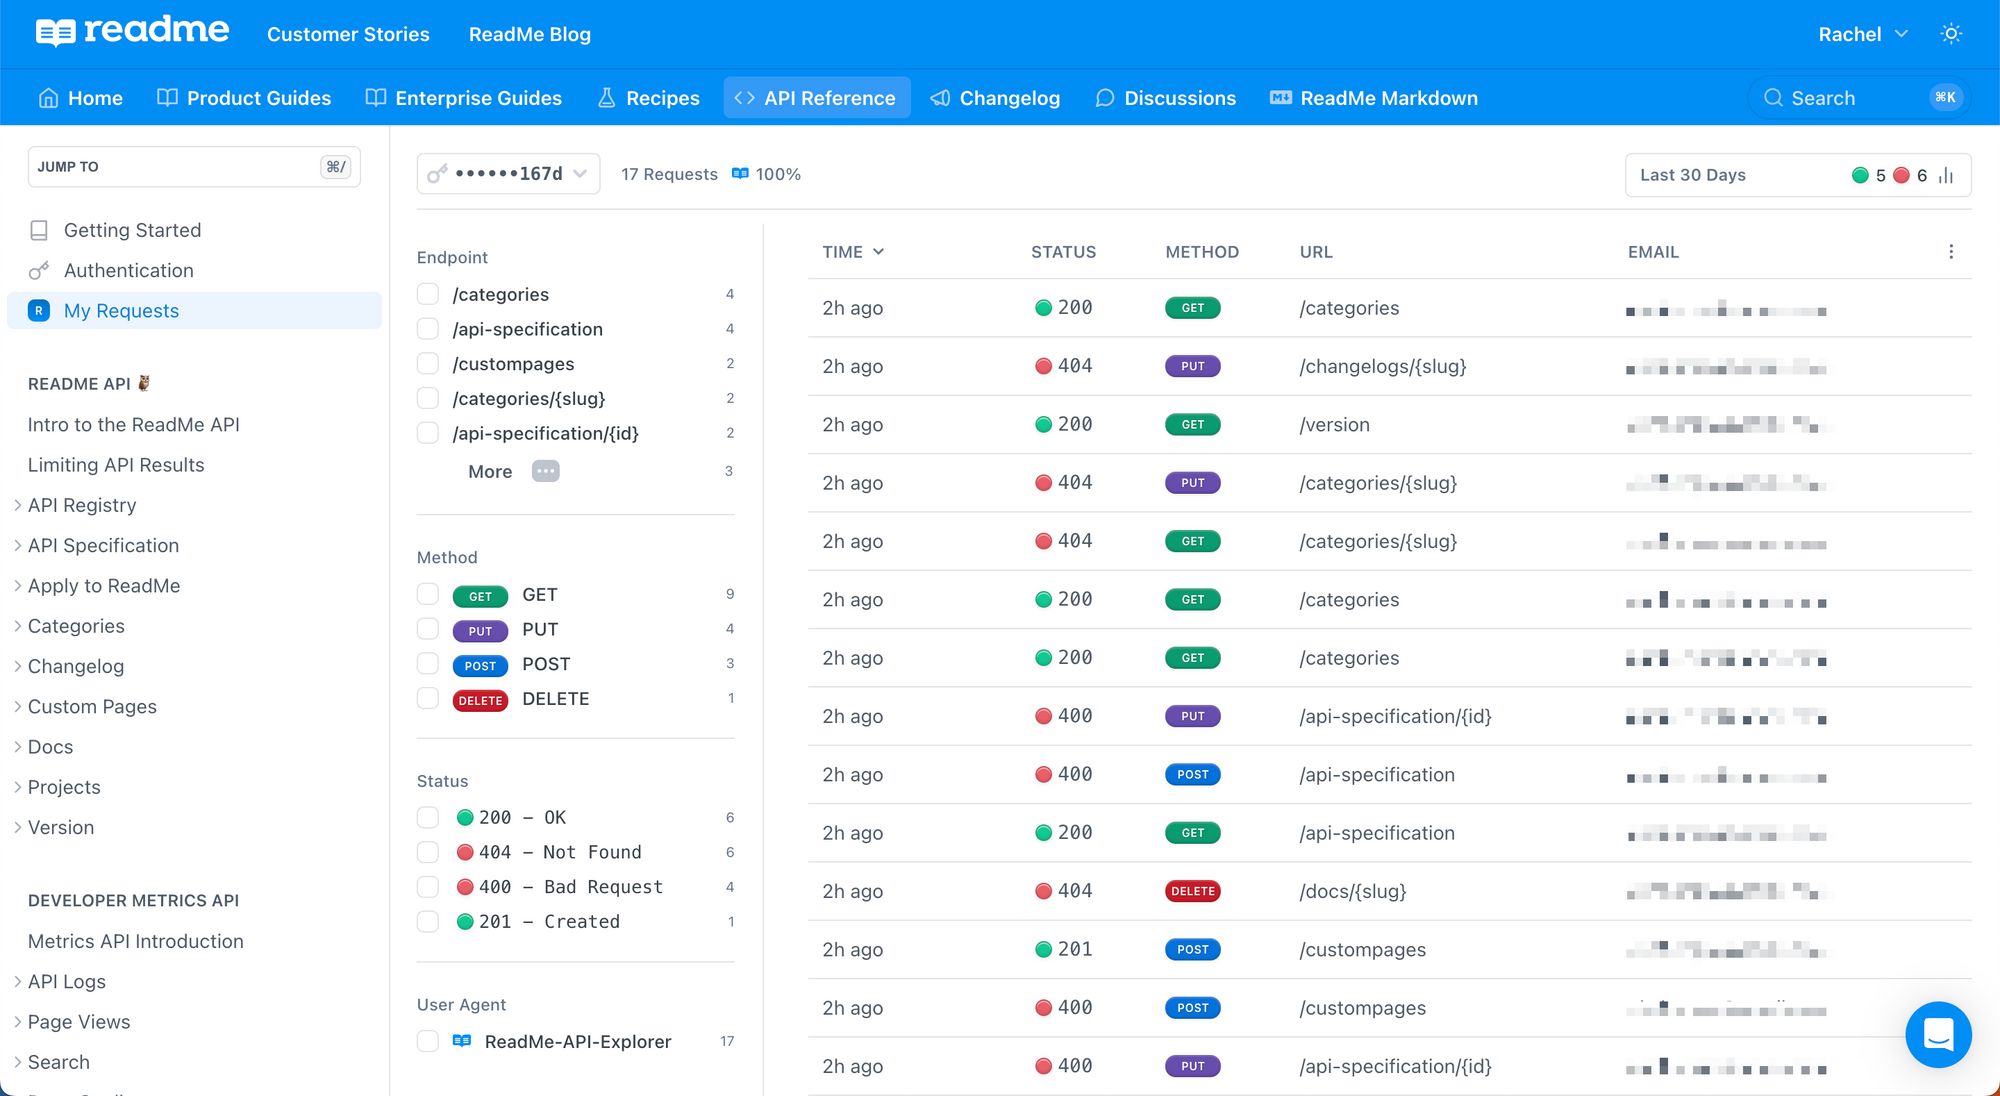
Using quick filters for endpoints, method, status, and/or user agent, users can hone in on failing requests (and check to see what’s different about their successful calls). They can also click into any log to reveal even more details related to their request and response.
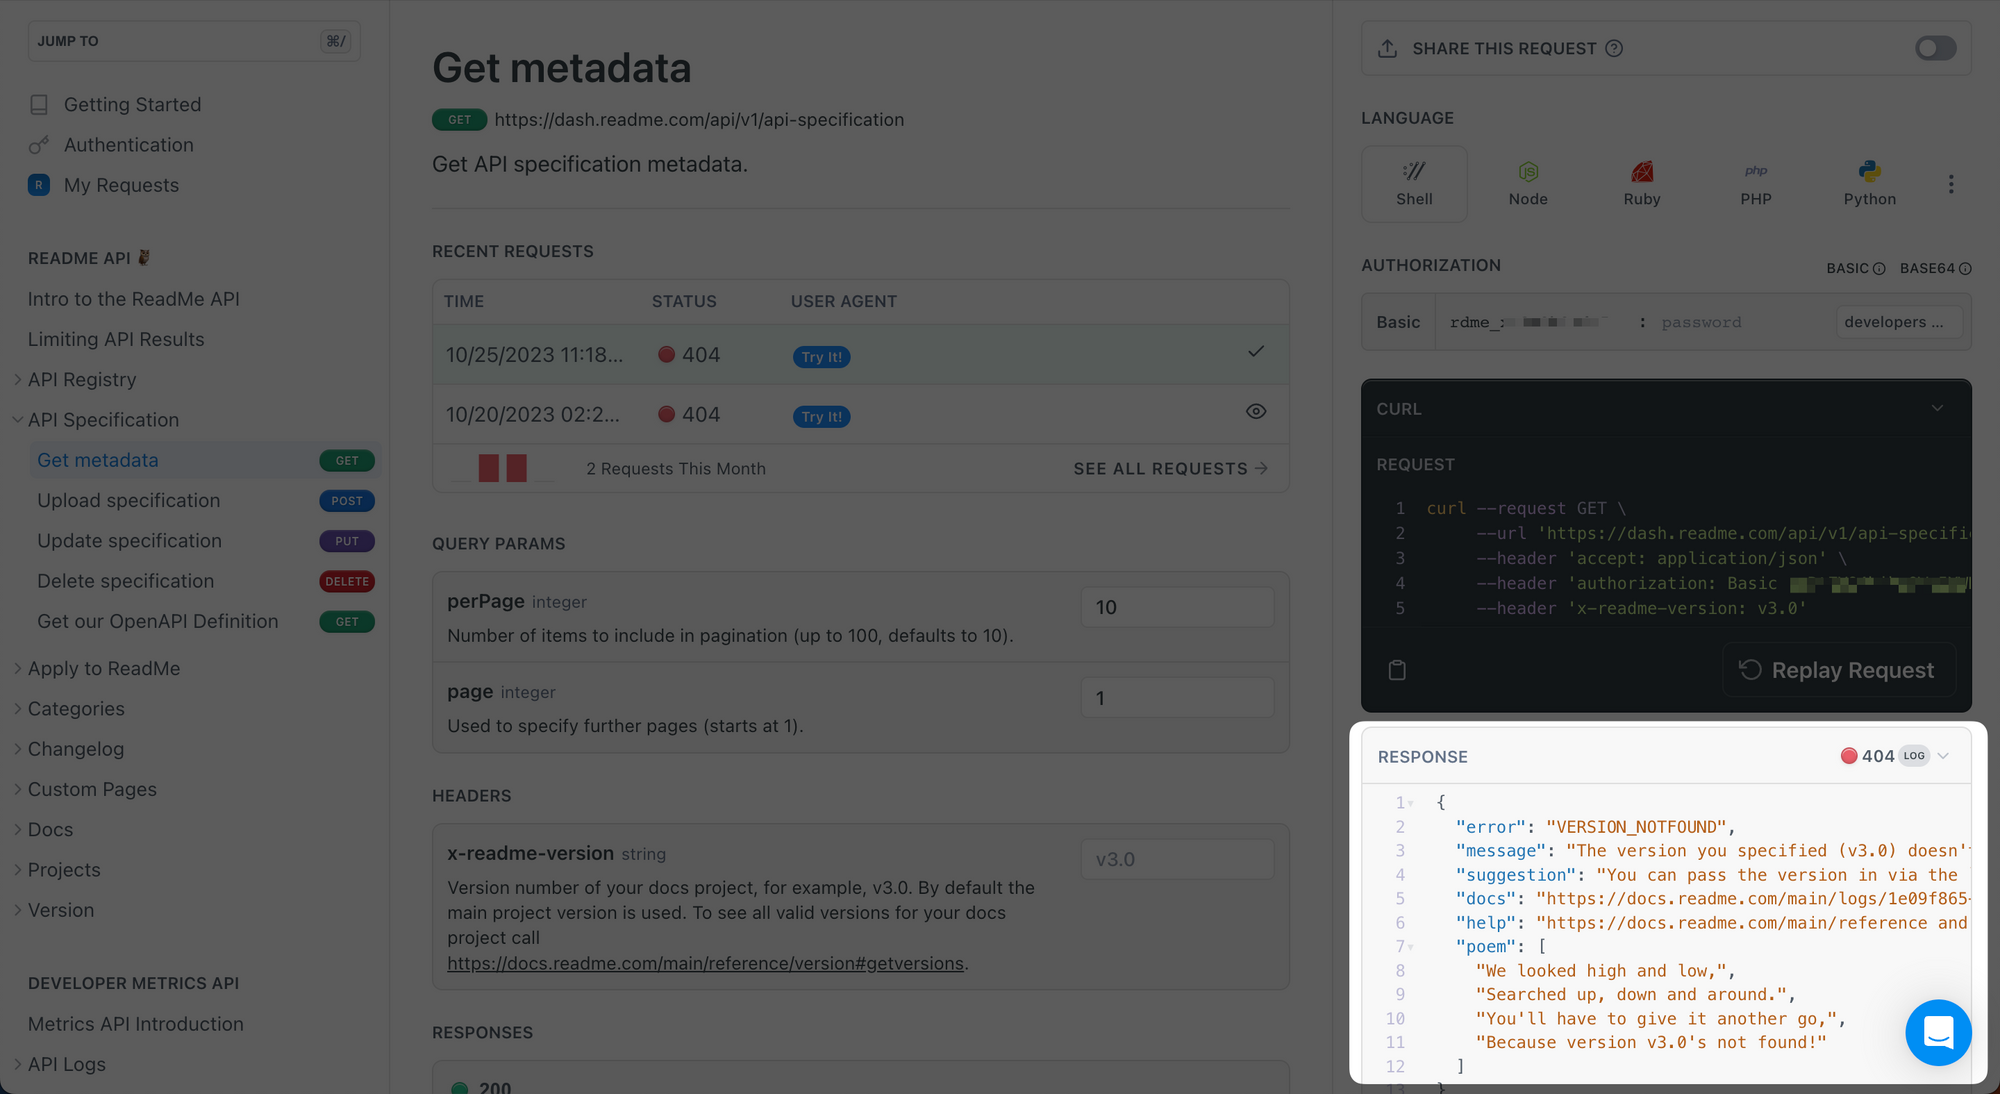
Alternatively, users can navigate to the endpoint page to replay any individual log in the Try It playground to dive deeper. Bonus points for extra helpful error messages that give them a hint at what’s gone wrong 😎
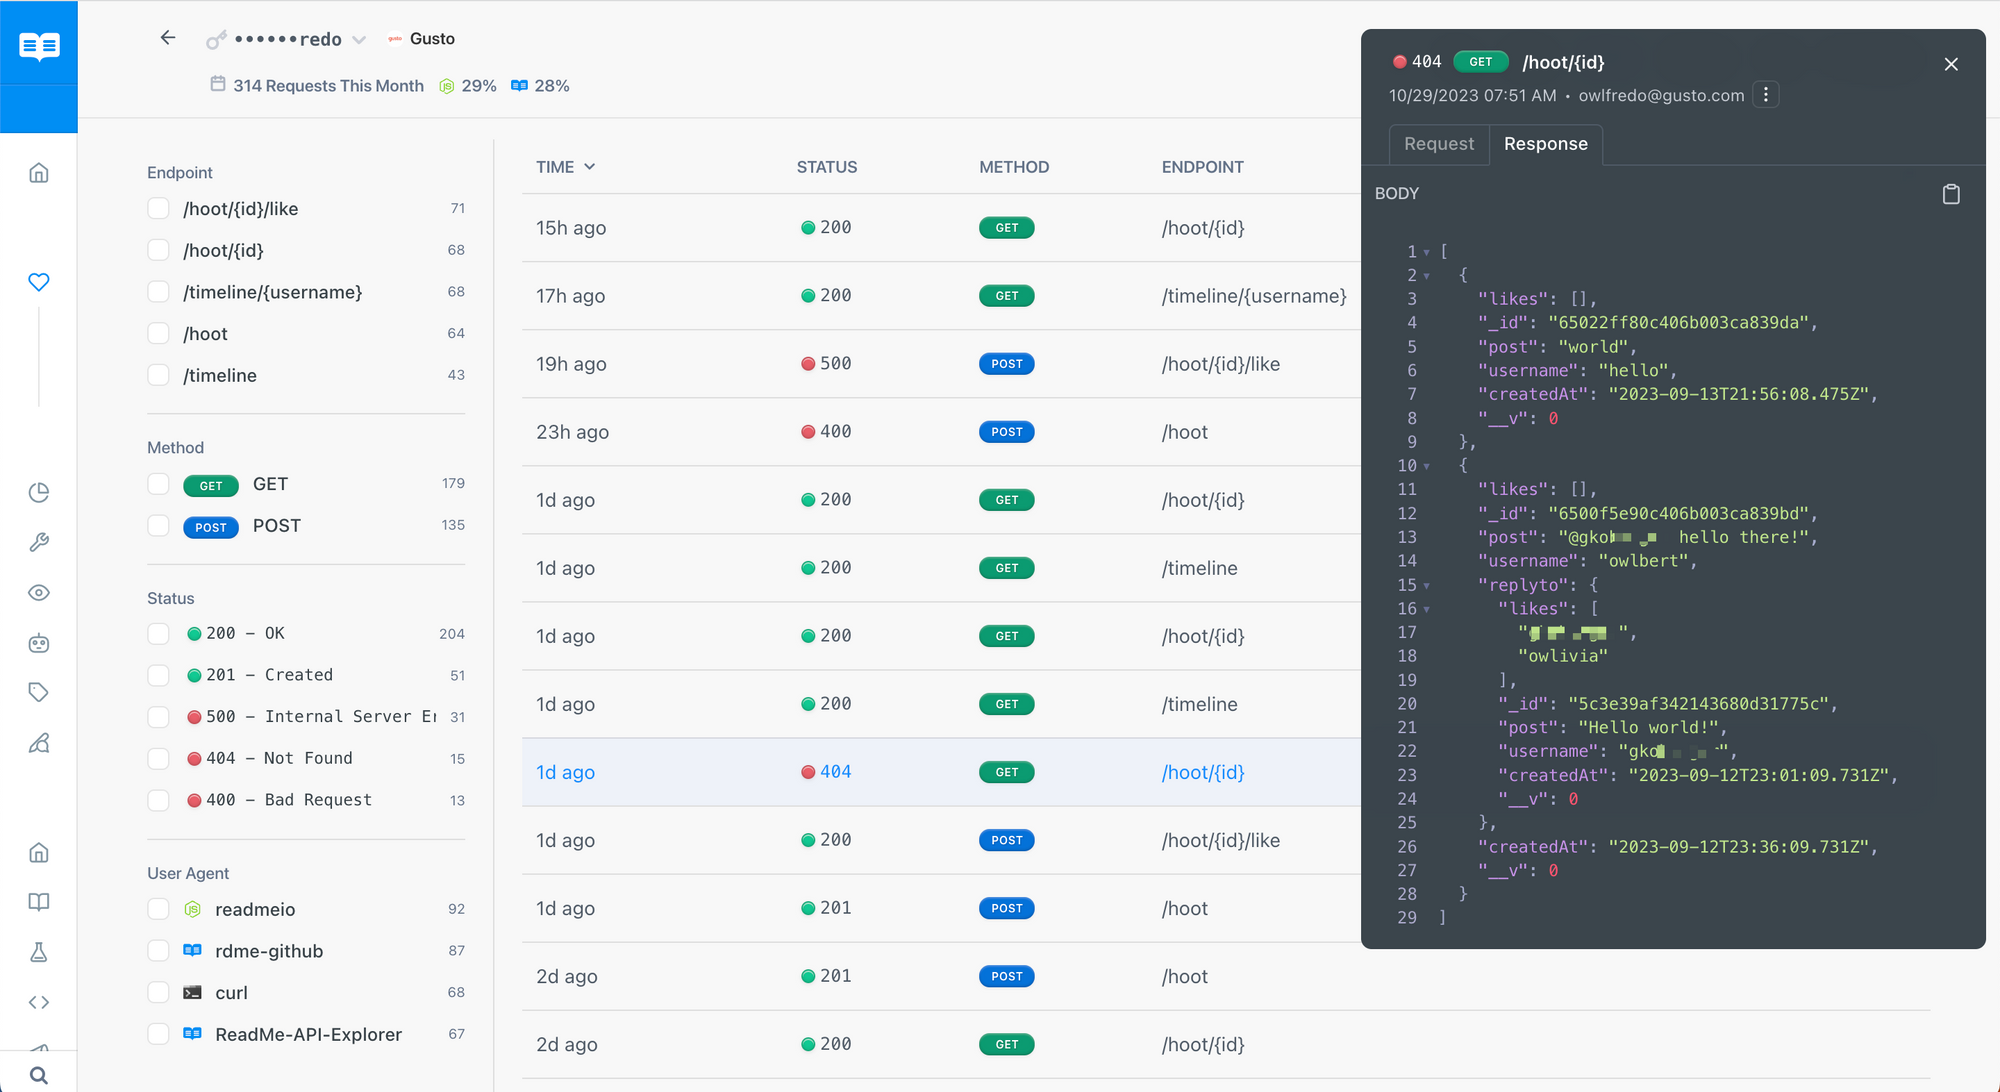
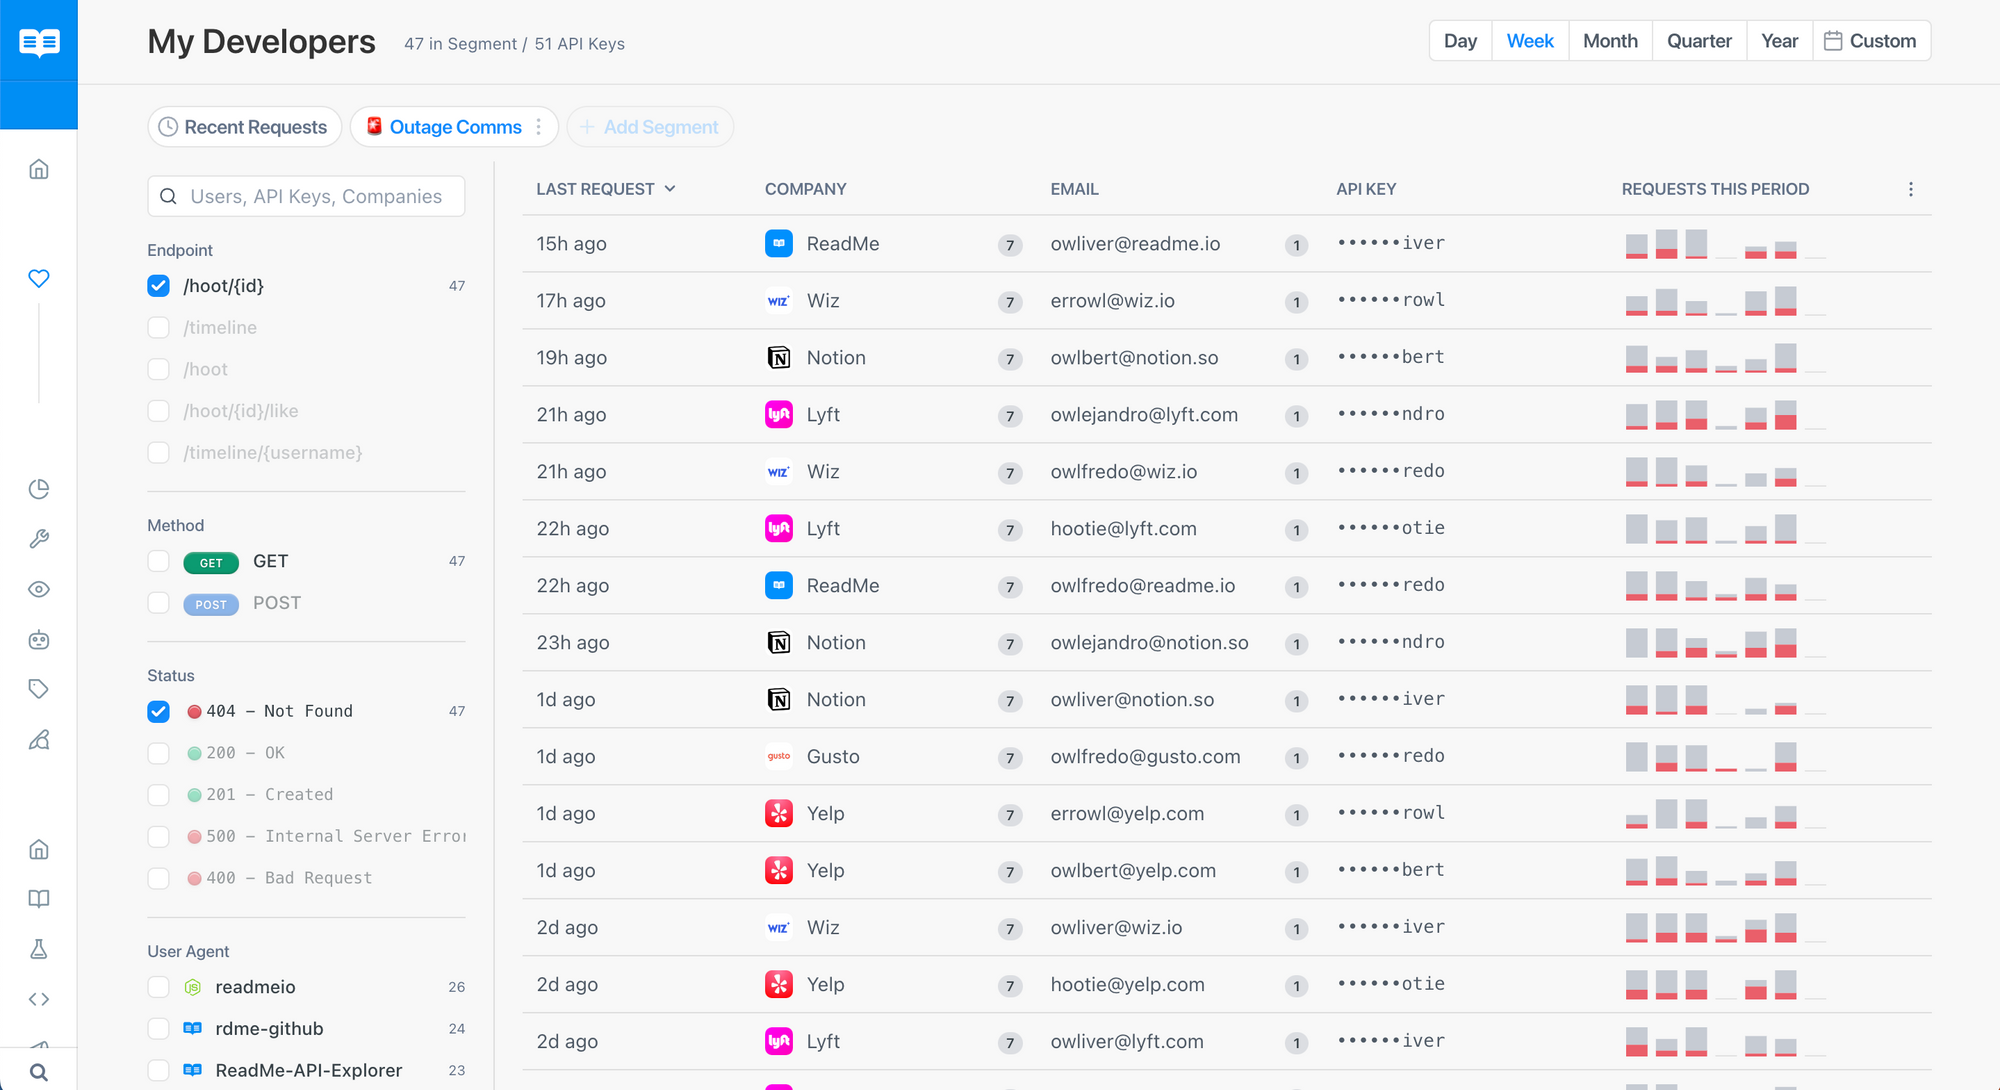
And for ReadMe Admins, we’re taking this debugging workflow a step further with My Developers, in-depth developer profiles where your team can dig into API usage and quickly debug issues. Just as we surface API keys and real-time logs to end users in your developer hub, My Developers gives your team the backend interface to see who’s having issues, identify fixes, and seamlessly support your developers to get them back on track.
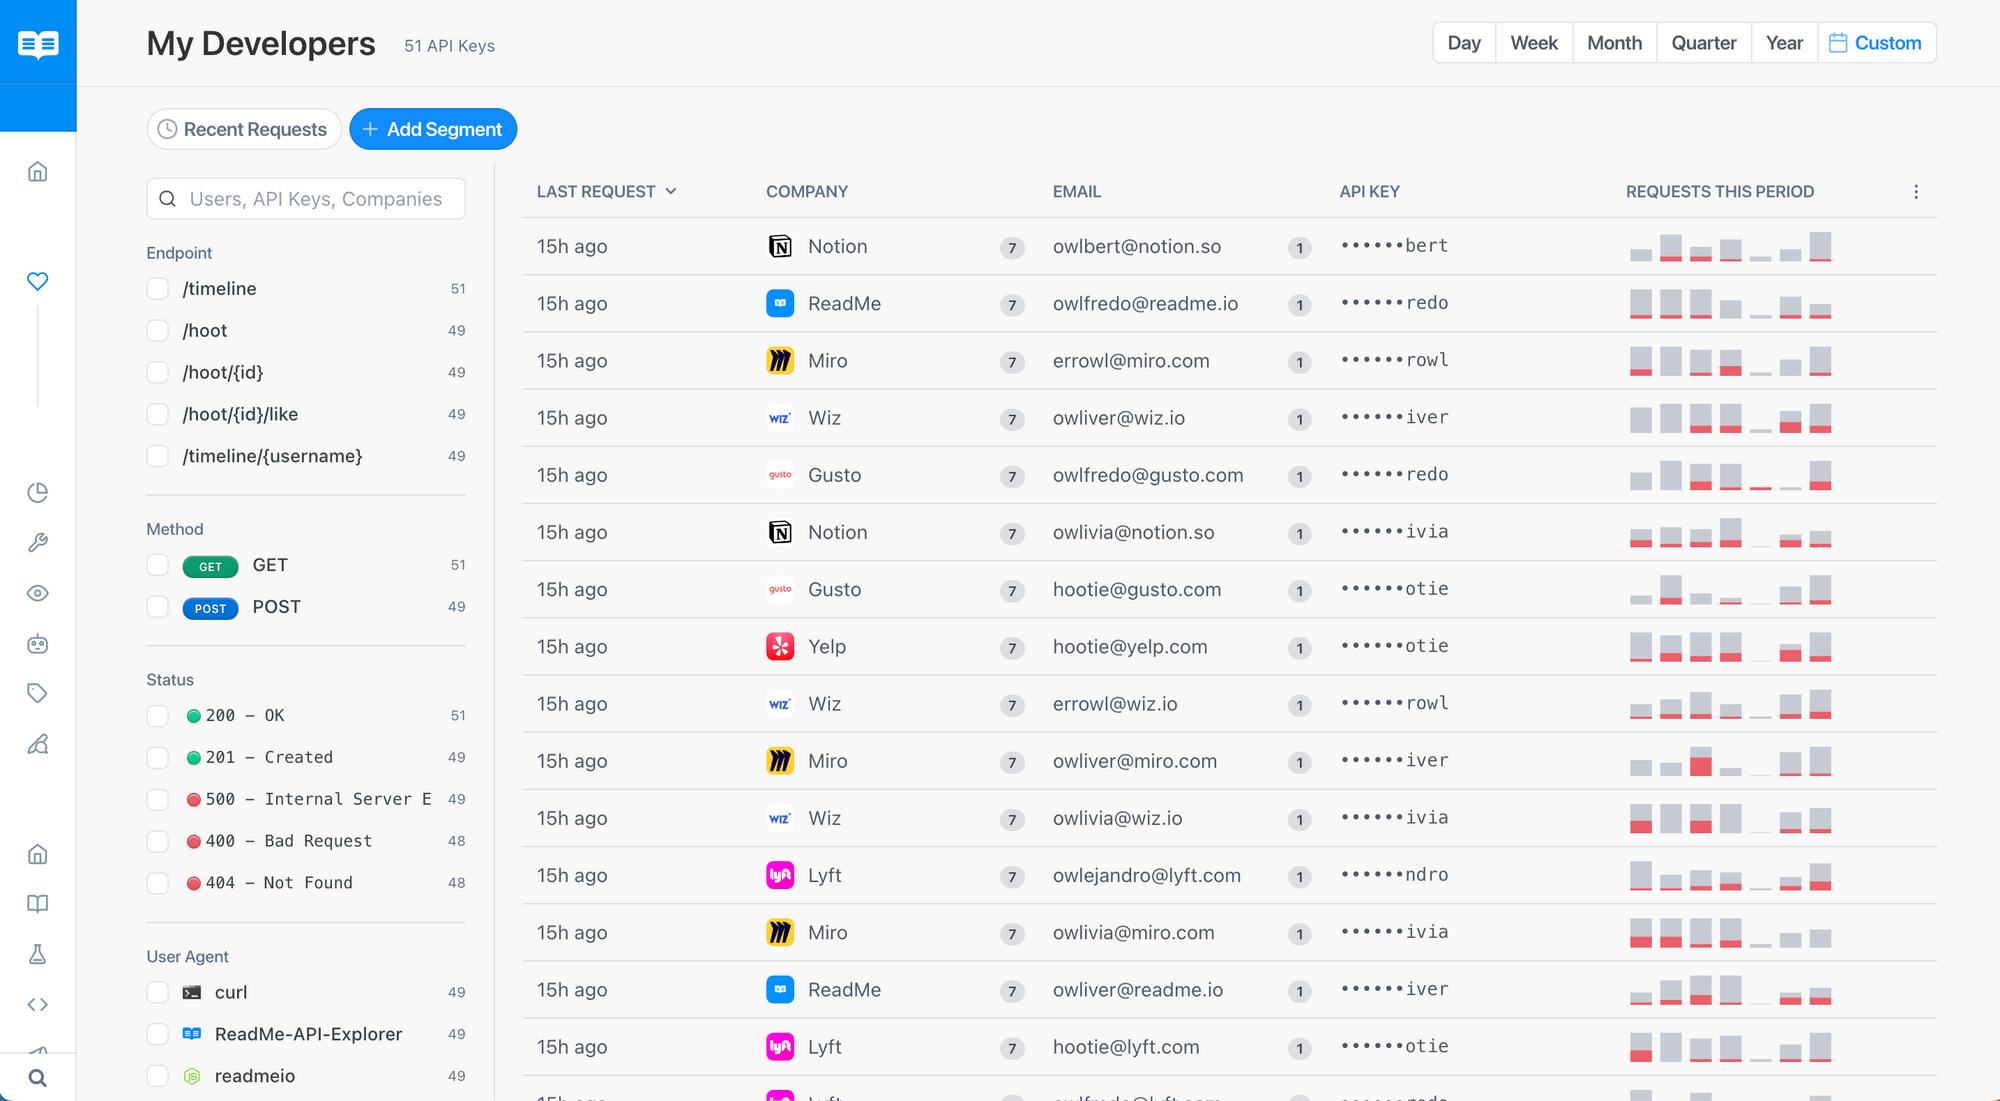
Powered by your real-time API request logs, the magic of My Developers lies in filters ✨ By honing in on certain endpoints, methods, and status codes for a given time period, you can build and save segments to monitor usage of your APIs:
- Track who’s getting lots of 🔴 400s this week to reach out and offer a helping hand
- See who’s using the endpoint you recently launched 🚀 to get feedback on their use cases
- Look up a user’s logs 🔍 when they write into support to help them debug issues
And when users write into support with an issue, Admins can quickly look up a user by their API key, email address, or company to jump into their logs and see what’s going on. No more copy and pasting request code back and forth in emails to try to get support reps on the same page — with ReadMe, users in the hub and admins behind-the-scenes can look at the same logs together.
Supporting your users in the long run
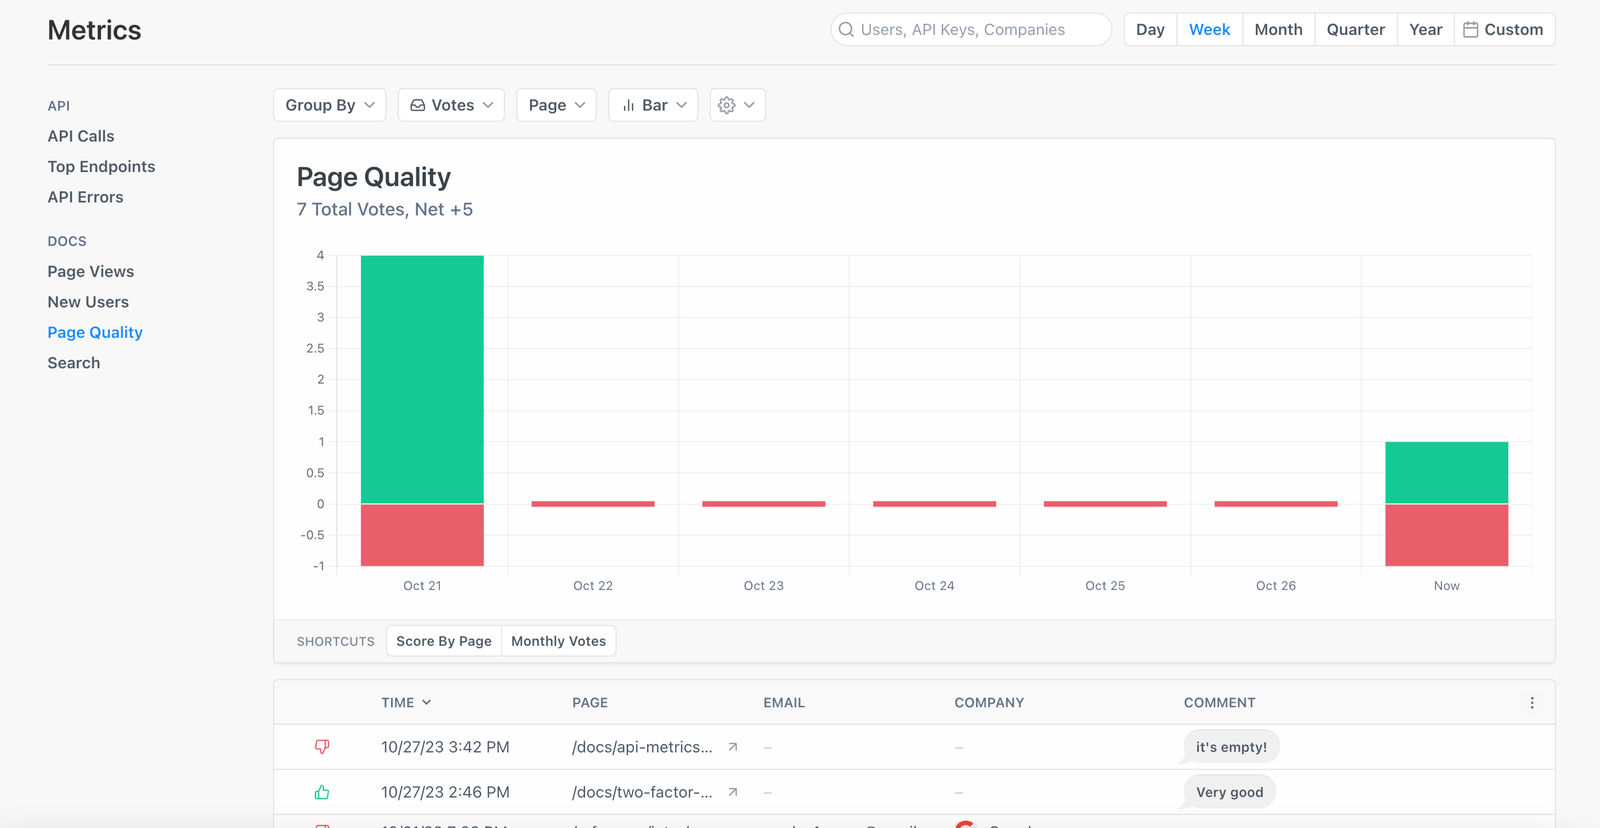
With the foundations of your API onboarding and debugging experience in place, it’s time to look toward the future 🛣 In addition to the vision for your APIs coming from your team, ReadMe gives you valuable insights to help inform these decisions. You can easily track usage metrics, like API adoption over time and API error volume, to see where users are getting stuck.
The Home screen also provides an at-a-glance snapshot of your Docs Metrics where you can see your most popular pages and search terms, and track new users over time. These metrics can inform what pages to prioritize updating, or to see what pages might need to be labeled differently based on high volume keyword searches.
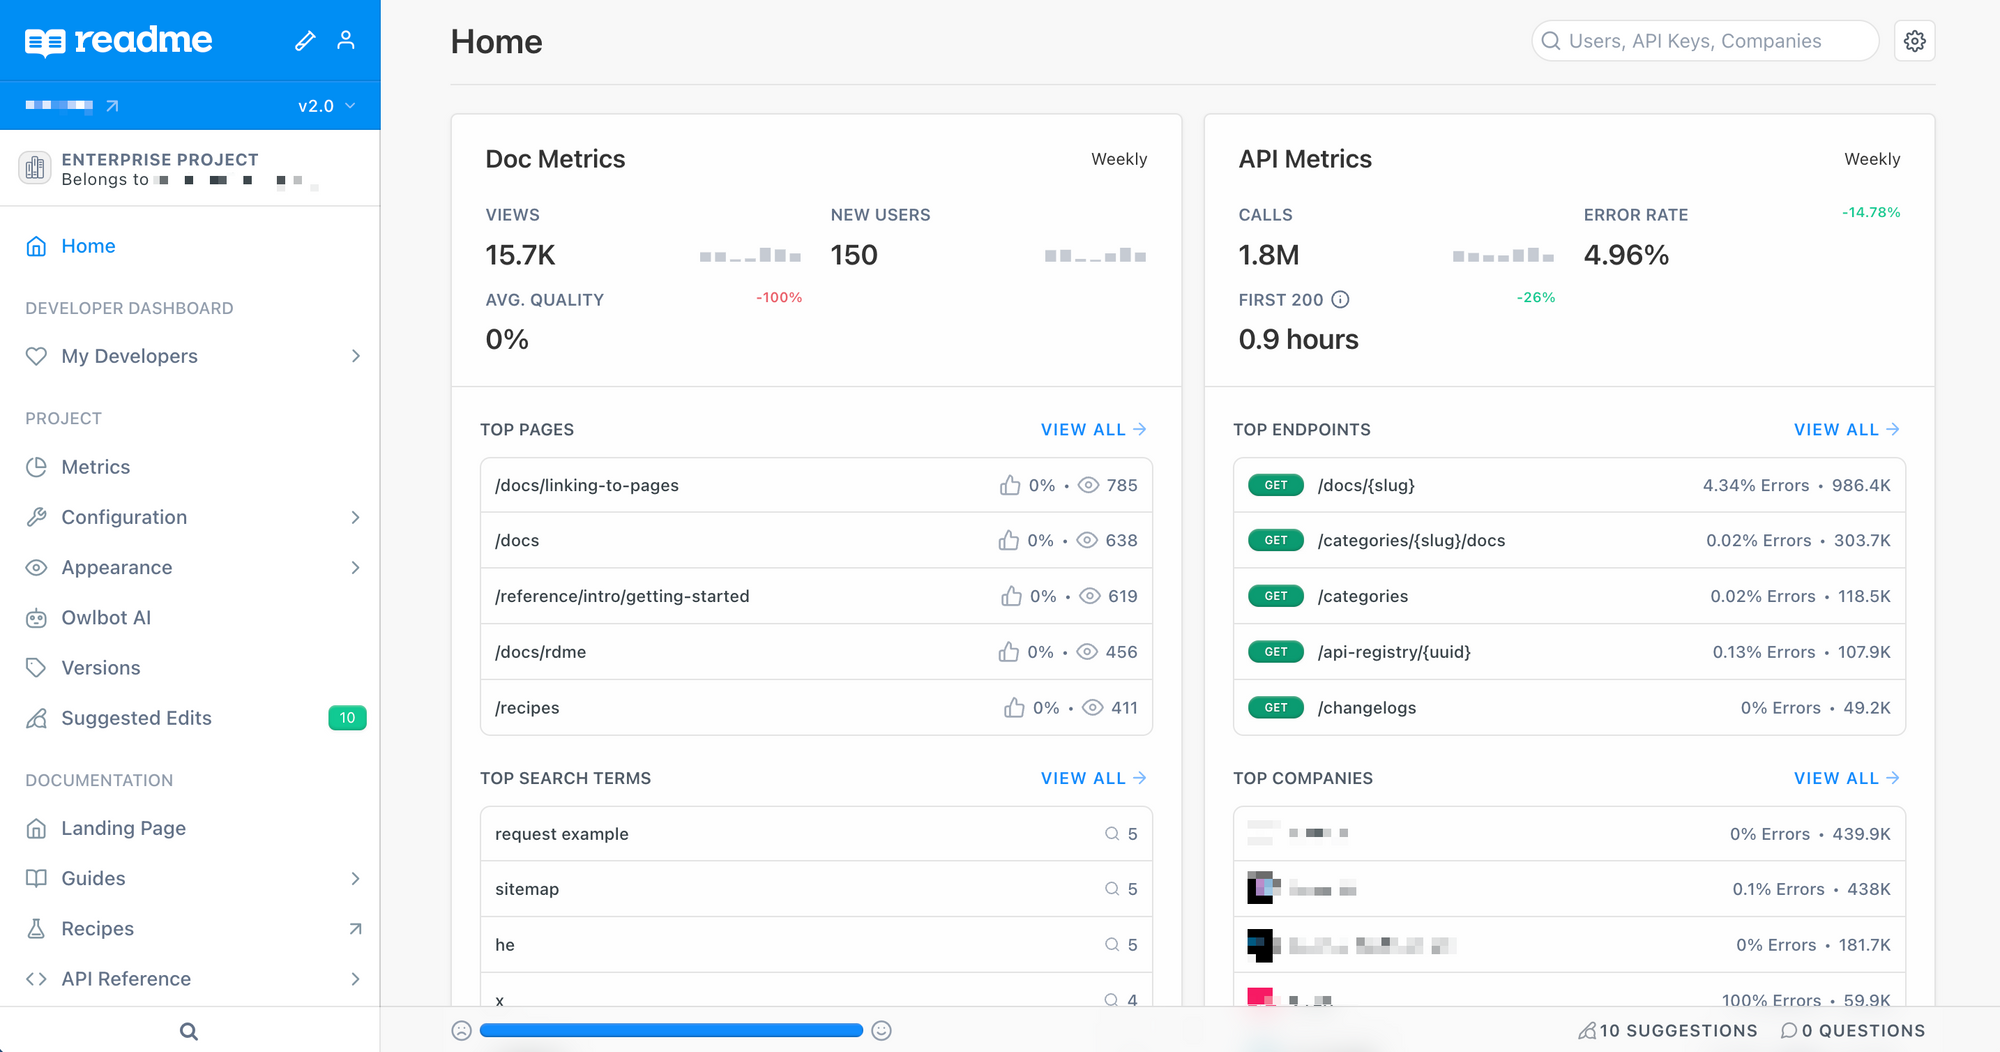
Together, all of these insights bring a data-driven lens to decisions about where to add features and invest resources to improve your API and documentation. You can also export your metrics data as a .CSV file for further analysis or cross-referencing with other data.
As you ship new versions or deprecate endpoints, My Developers makes it easy to diagnose who will be impacted so you can proactively reach out and help them through the transition. And as much as we don’t like to talk about security incidents 😬 in the event of an API key leak, you can quickly pull a list of keys that were active during the affected time period for communications around revoking and rotating their keys. You’ll be happy to have the tooling in place to support your team in these moments (infrequent as they may be): hope for the best, plan for the worst!
What’s coming next
You’re here to support your developers, and we’re here to support you! We’d love to hear your feedback on Developer Dashboard as you start exploring the features and functionalities. Head over to the docs to learn about all the features and benefits of the full Developer Dashboard experience 🎉 Access to 24 hours of data is included in every ReadMe plan, so you can take it for a spin worry-free.